Featured project: DEPRIMAP - AI-driven Mapping of Urban Deprivation and Climate Vulnerability at Global Scale
Project actors: Sai Ganesh Veeravalli, Stefanos Georganos, et al.
Project website: https://sola.kau.se/deprimap/
1. Context: Urban Deprivation as a Climate Risk Multiplier
Deprived Urban Areas (DUAs) are neighborhoods where overcrowding, inadequate infrastructure, and limited access to services undermine daily life. While slums are one form of DUA, deprivation also occurs in other urban settings such as poorly serviced housing estates and rapidly expanding peri-urban areas. These communities are often located in high-risk zones and lack protective infrastructure, making them disproportionately exposed to climate hazards such as floods and heatwaves.
Despite their scale, projected to exceed 2 billion people by 2030, DUAs remain poorly represented in global datasets and urban planning systems. Many censuses are outdated or exclude informal settlements / slums, and existing global population products capture only a fraction of these populations. This data gap limits our ability to accurately assess climate risk and design targeted adaptation strategies.
2. What DEPRIMAP Does
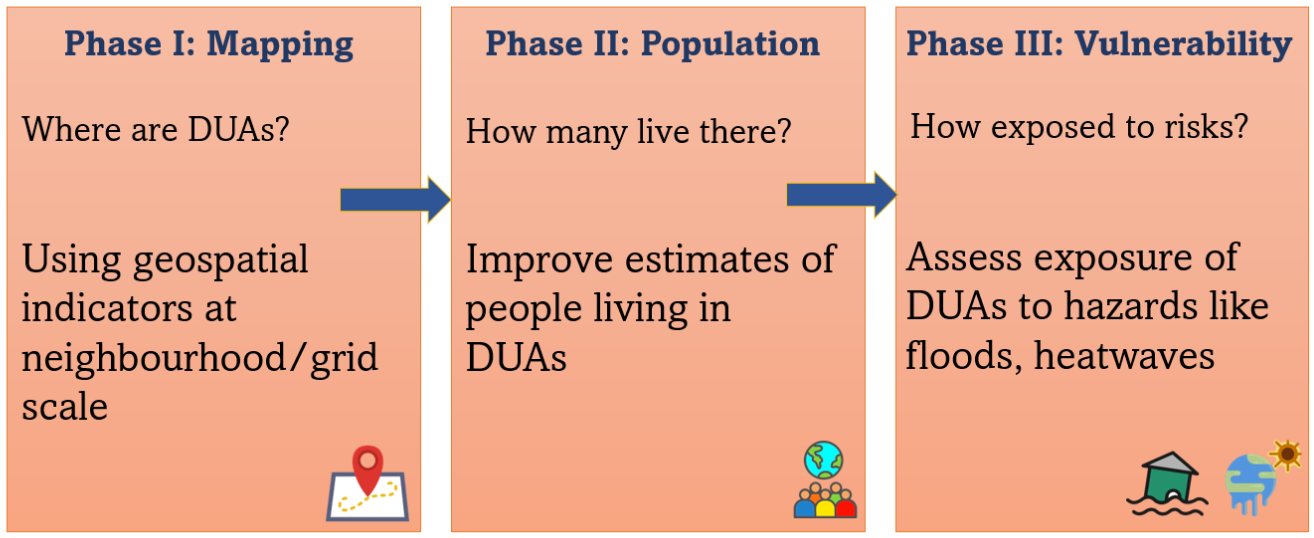
DEPRIMAP is structured as a three-phase framework to systematically analyze urban deprivation and its climate implications.
Phase I – Mapping: Identify deprived urban areas using geospatial indicators derived from satellite data and other spatial data sources, capturing patterns of building density, layout, and infrastructure.
Phase II – Population: Estimate how many people live in these areas by integrating mapped extents with bottom-up spatial population modelling approaches.
Phase III – Vulnerability: Assess how exposed these populations are to climate hazards such as floods and heatwaves by combining deprivation maps with spatial hazard data.
3. Technical Approach
DEPRIMAP combines Earth Observation data with machine learning to analyze urban environments at neighborhood scale. The framework integrates globally available datasets on buildings, roads, land cover, and derives spatial indicators that capture urban form and infrastructure conditions. These features are used within supervised learning models to identify patterns associated with urban deprivation. Designed for scalability, the approach can be applied consistently across thousands of cities, enabling comparable assessments in data-scarce regions.
4. Why This Matters for Climate AI
Climate risk is not evenly distributed within cities. Populations living in deprived urban areas often face a combination of high exposure to hazards and limited adaptive capacity due to inadequate infrastructure, insecure housing, and restricted access to services. Yet most climate risk assessments and urban datasets treat cities as homogeneous units, overlooking these intra-urban inequalities.
DEPRIMAP addresses this gap by providing spatially explicit information on where vulnerable populations are located and how they intersect with environmental hazards. This enables more targeted climate adaptation planning, improves risk modelling, and supports monitoring of global development frameworks such as SDG 11.1.1. By making hidden and underserved populations visible in data, the framework contributes to more equitable and effective climate decision-making.
5. Example Outcomes of Project
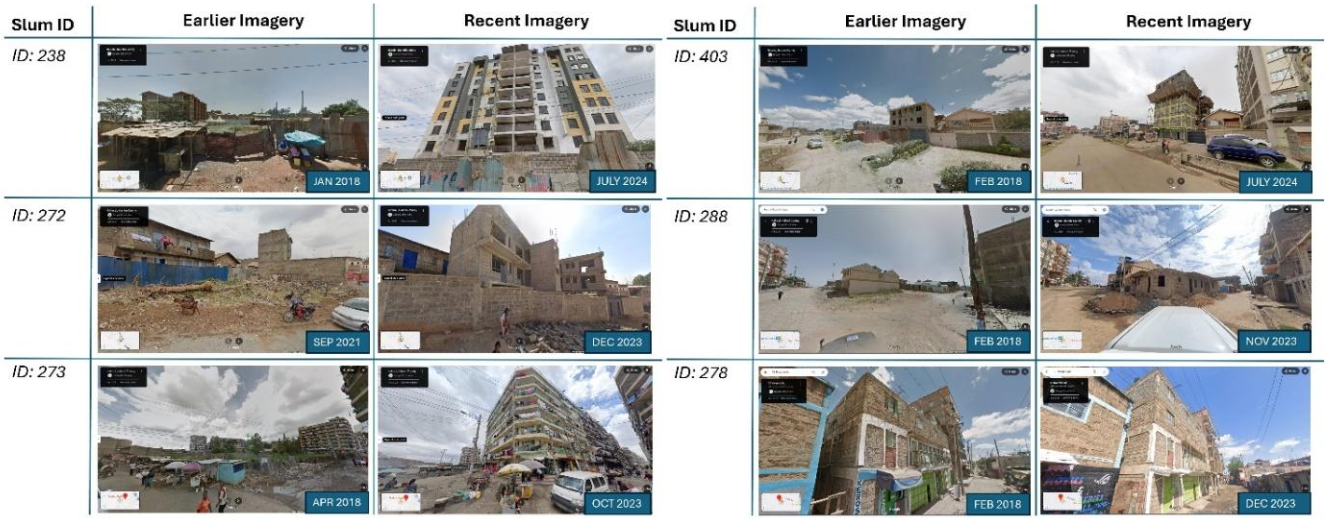
(A) Understanding Informal Settlement Transformation through Google’s 2.5D Dataset and Street View based Validation: Using Google’s Open Buildings 2.5D temporal dataset (2016-2023), this study analyses how informal settlements evolve over time. A rule-based classification on 100-meter grid cells identifies four change types: vertical densification, horizontal densification, combined growth, and decline. Validation using Google Earth Pro and Google Street View achieved 96.7% accuracy. Results show that horizontal densification dominates within informal settlements, while vertical growth is more common in surrounding formal areas, highlighting distinct development patterns within cities.
Example pairs of earlier and recent Google Street View imagery used for validation across different slum locations.
(B) Towards a Spatial Measure of SDG 11.1.1: Open Data for Urban Deprivation Mapping: This work introduces a scalable, open-data-driven framework for mapping urban deprivation using six indicators related to building morphology, vegetation, and infrastructure. Applied first in Nairobi and then across seven global cities, the framework demonstrates strong spatial alignment with known deprived areas. The analysis highlights globally robust indicators, such as building size and tree presence, while also revealing context-specific limitations, underscoring both the potential and challenges of globally transferable deprivation mapping.